Fig. 3.7. The West African Coastline on Two Charts
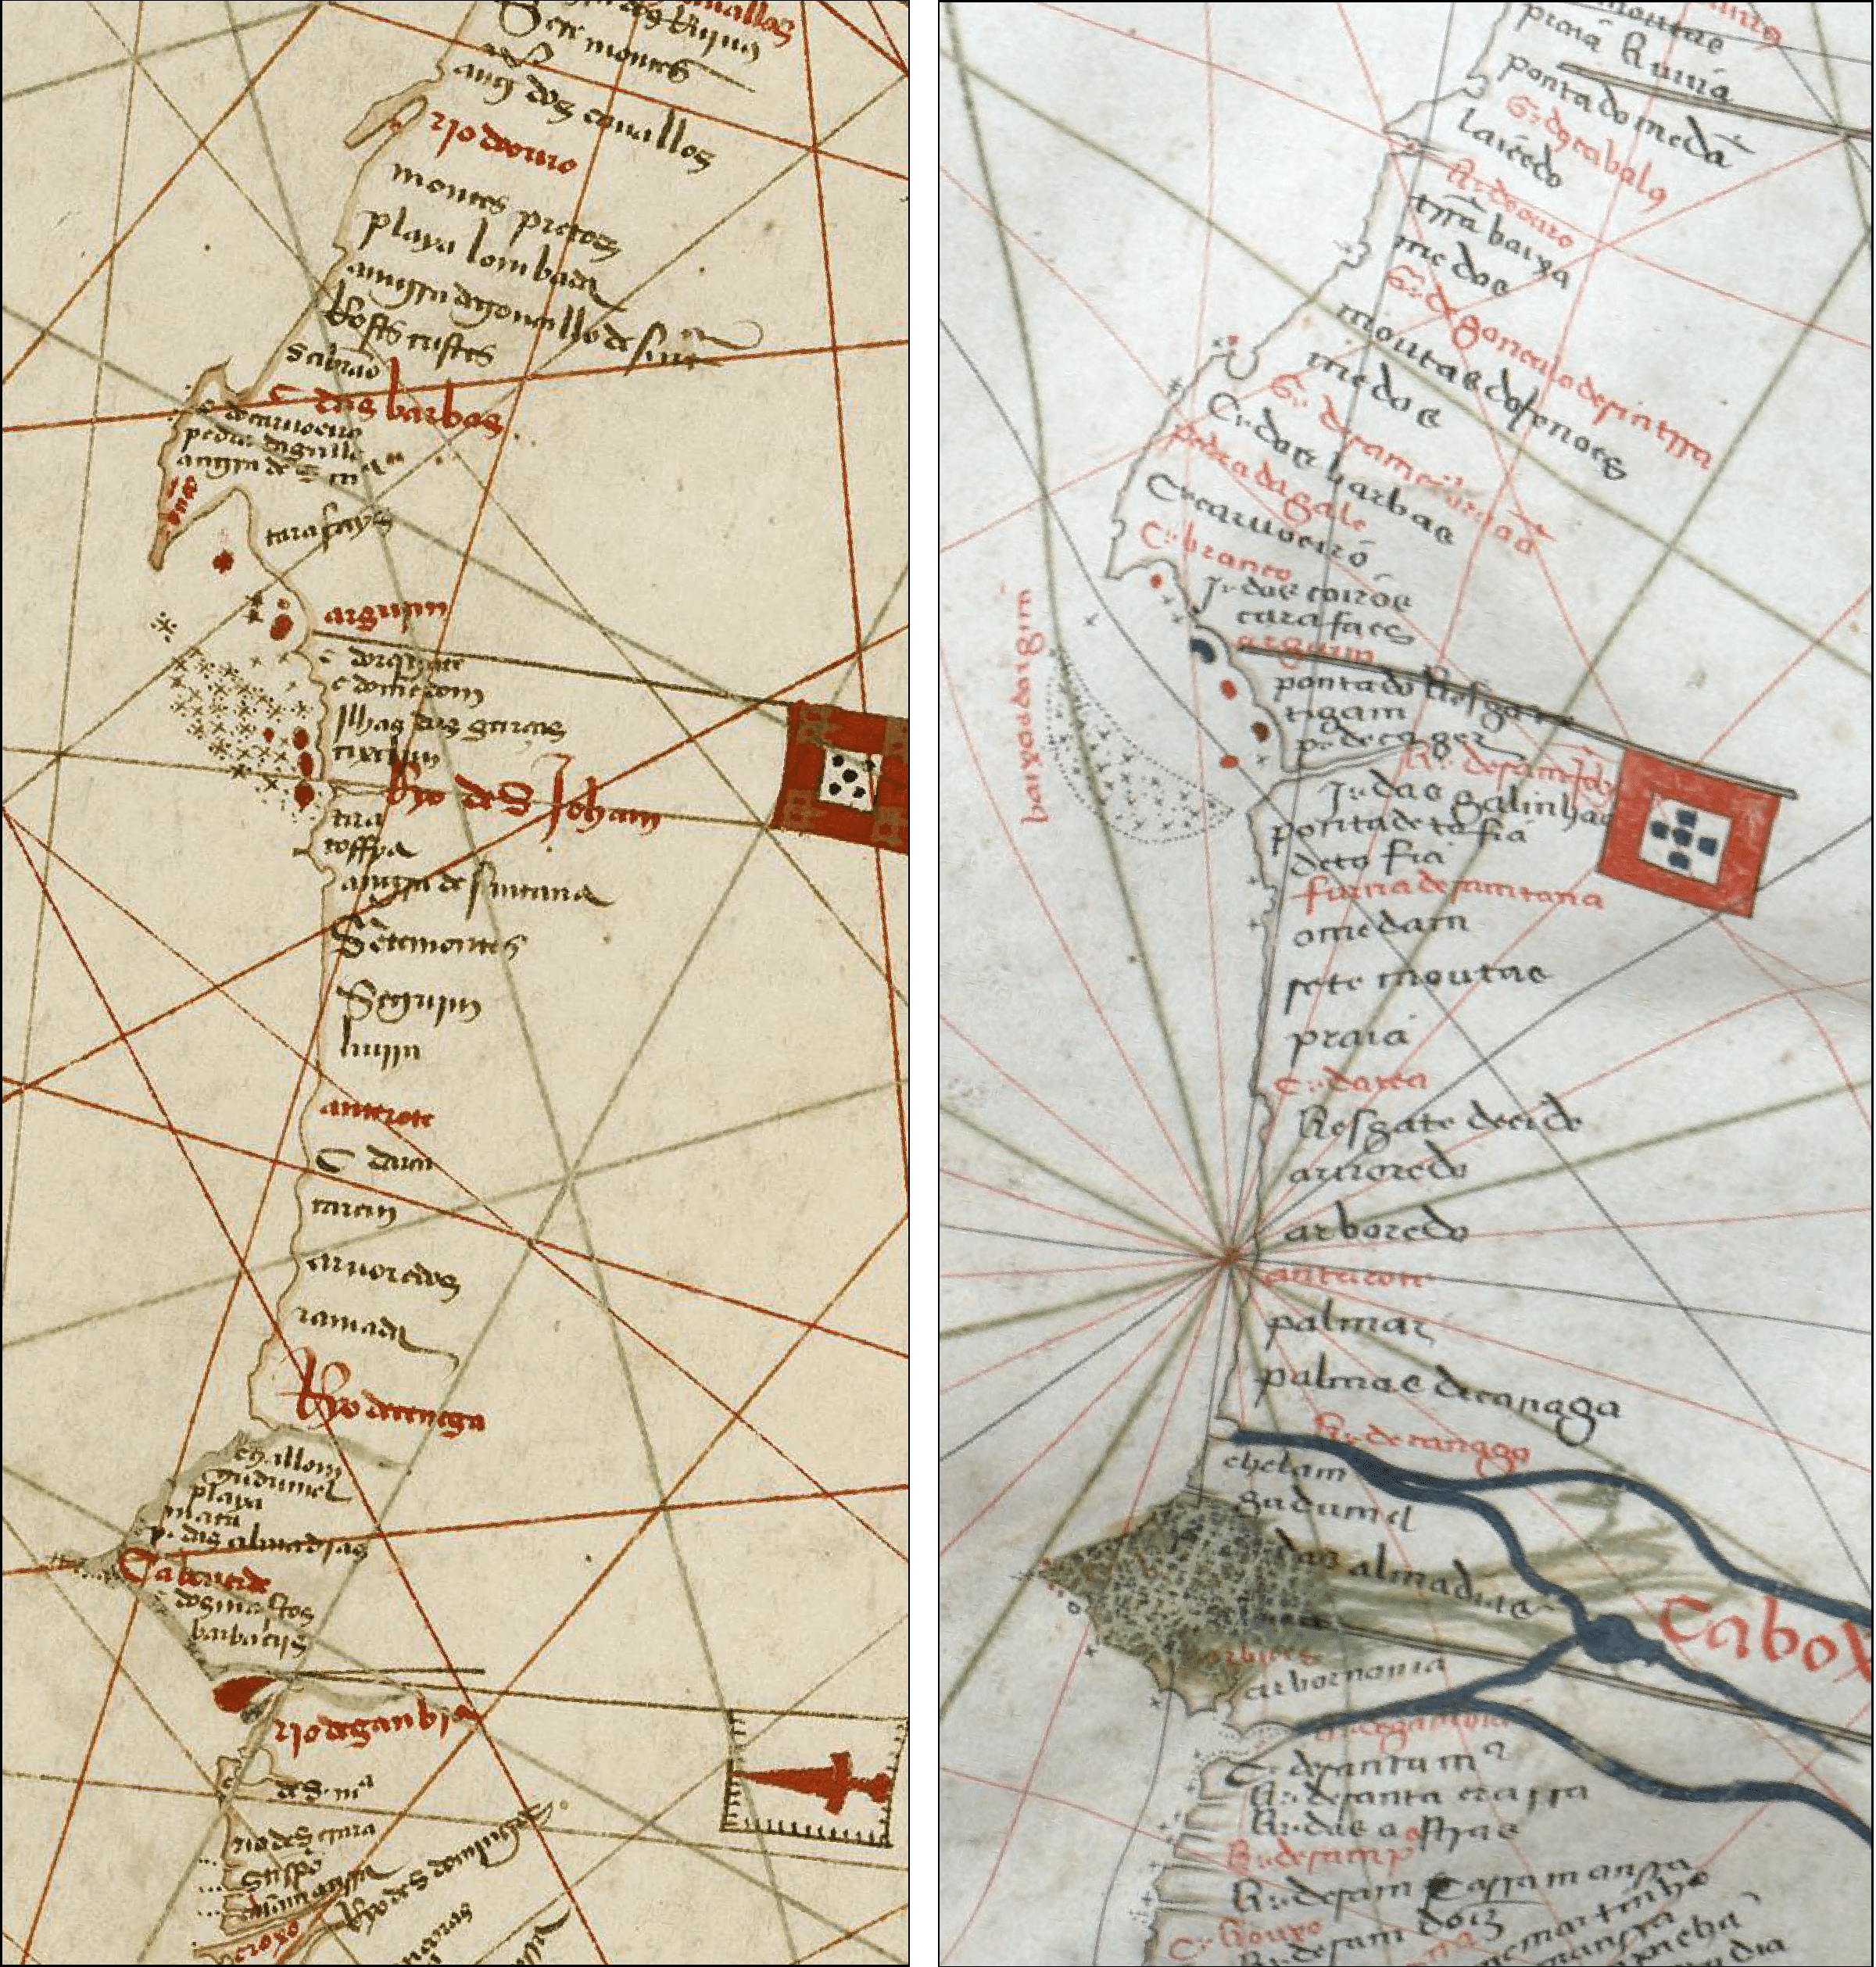
Carta nautica, ca. 1471-82 (left), and Aguiar, Portolan Chart of the Mediterranean, 1492 (right).
Coastlines are essential features on charts, and the Atlantic first appeared as chartmakers mapped the eastern coastlines. Chartmakers entered coastlines on their charts as a fine line, sometimes highlighted with a light color. Dangerous places for sailors, such as shoals and reefs, appear as dots and crosses. This figure shows the section of the West African coast between Cabo Branco and Cabo Verde on two fifteenth-century Portuguese charts. On the left is the anonymous Carta nautica (see plate 8) and on the right is Aguiar’s Portolan Chart of the Mediterranean Sea (see plate 9). The chartmakers presented the same geographic information in slightly different ways. Each placed a Portuguese flag at Arguim, the Portuguese trading post (feitoria) south of Cabo Branco. Each marked the shoals with a series of dots and crosses, and each stylized the coastlines. The chartmakers made different choices for other geographic features, such as islands, river mouths, bays, and promontories. Aguiar painted islands in both blue and red, richly illustrated Cape Verde with green, and selected a bright blue for the Senegal River (Rio Çanaga). The Carta nautica is plainer.
This figure was created in ArcGIS using high resolution digital raster images of each chart georeferenced at two control points: Cabo Branco and Cabo Verde.