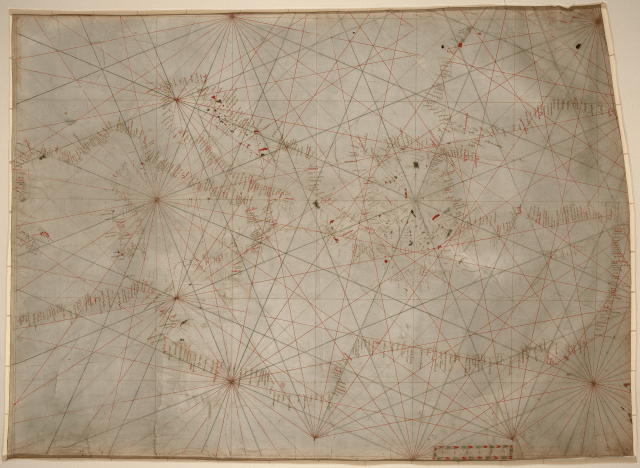
Fig. 3.4. Portolan Chart of the Mediterranean, ca. 1320-50
Geography and Map Division, Library of Congress, Washington, DC.
The Portolan Chart of the Mediterranean made by an anonymous chartmaker sometime between 1320-50 has all of the basic elements of a nautical chart. In contrast to maps, which depict land, charts are designed to facilitate navigation at sea. The network of lines, known as rhumbs, are the most prominent feature of the chart, and they cross both land and sea. The rhumb lines emanated from points located on the chart, and the chartmaker used color to differentiate the lines; these color-coded lines made it easier for mariners to read the compass directions at sea. The most important information on the chart are the coastlines of the central and eastern Mediterranean and a section of the Black Sea. Associated with the coastlines are toponyms–place names–that are lettered in at right angles on the land side of the coastline. Most of these toponyms are inked in black, but the chartmaker used red for the more important places, such as Rome. The chart has no imagery, and it contains no textual legends. A scale is added near the bottom right.
